
Driving Revenue with Strategic Tech Debt Management
If managed well, fixing tech debt can do more than just reduce costs

I recently hosted a roundtable on technical debt at LeadingEng with Dan Na.
It was interesting hearing from a variety of leaders (albeit biased toward caring about tech debt) how they manage their organizations.
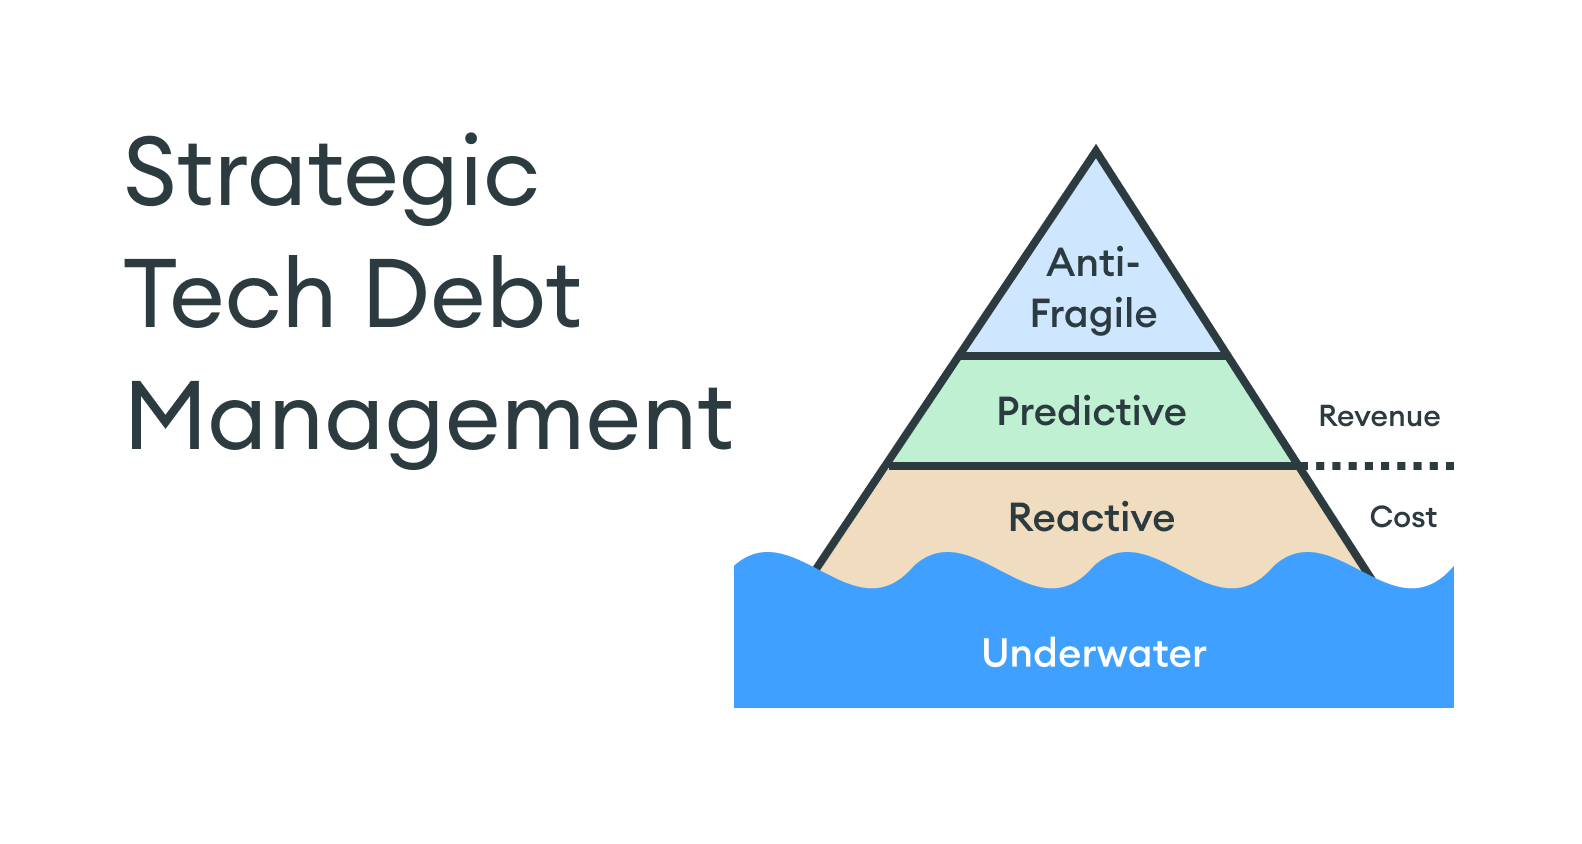
With tech debt, some teams are underwater. They’ve made bad decisions in the past, and tech debt has already cost them more than it would have to fix early on.
For leaders in this situation, it’s straightforward to get buy-in for fixes because you can point to real ongoing business impact (project delays, outages, attrition, etc.)
The roundtable attendees were actually not in this situation. They stayed on top of tech debt by monitoring metrics like time spent fixing bugs and addressing the root cause.
However, they were not fully satisfied with that approach because it still felt fundamentally reactive.
The question arose: What does it look like to manage tech debt strategically and shift from reducing costs to driving revenue?
A major hidden cost of tech debt comes from missed opportunities the organization cannot pursue due to limiting technology.
Organizations that employ a predictive approach to model the impact of tech debt in likely future scenarios can avoid this opportunity cost and enable growth.
The final million dollar question is: how do you prepare for unpredictable events? No one could have foreseen COVID or the rapid ascendance of generative AI, yet some companies won big while others floundered.
The highest form of tech debt management is an anti-fragile approach, which focuses on general capabilities to help organizations thrive in a chaotic, uncertain future.
This article shows how to elevate tech debt management from reactive to predictive and then anti-fragile, transforming technology from cost savings into a strategic driver of growth.
Reactive tech debt management
The first step in effective tech debt management is tracking its impact on your organization today before it gets out of hand.
Leaders who do this well deploy a variety of metrics to monitor the various ways in which debt incurs real costs. They then link those costs to specific areas of tech debt to successfully advocate for improvements with business stakeholders.
Bugs
The first important area to track is bugs. Change Failure Rate is a key DORA metric that looks at how often deployments result in rollbacks, outages, or hotfixes. However, non-critical bugs can have a significant drag on development too. You should also look at total effort devoted to bugs using ticket counts, story points, time logs, or an effort model like the one in minware. Time allocated to bugs is a particularly helpful metric because you can arrive at dollars by multiplying engineering salaries.
To use bug cost for tech debt management, you also need to attribute bugs to their cause so that you can say “If we fix this tech debt, these bugs will go away.”
There’s no one-size-fits-all approach for this, but some organizations link bugs to the original changes where they were introduced. Others may use a coarse-grained approach of linking bugs to particular services, repositories, or areas of the code to approximate its cost.
Slower development
Another effect of tech debt is missed estimates and slower development. One leader I’ve spoken to asked engineers to record an “actual story points” field after completing tasks. He then used this to compute a missed estimate cost by code area to demonstrate the value of refactoring a particular service to his CEO. You can also do something similar with more granular time logs or effort modeling.
At my previous company, we asked engineers to write down a percentage of time lost to tech debt during each sprint retrospective and note the cause. This gave us a clear picture of where we needed to invest in paying down tech debt.
Morale
The most insidious impact of tech debt is bad morale. It’s easy to overlook in the short term, but losing your best people is incredibly detrimental.
It’s essential to keep a pulse on how people feel about tech debt. You and your managers should ask about it in one-on-ones, surveys, and exit interviews.
Depending on the culture of your organization and whether they pay top-of-market for engineers, management may not be receptive to morale as a business justification for fixing tech debt.
Regardless of management attitude, however, you should know when tech debt is putting your best people at risk and push harder on the other reasons for fixing it.
The flipside is that engineers who are most bothered by tech debt are often the most energized by fixing it. If they would otherwise leave, putting them on these projects can be a win/win.
Predictive tech debt management
After you have a healthy program for reactive tech debt management, the next step is to look at the impact of tech debt on the predictable future. This section looks at two ways to do this.
Immediate roadmap impact
Before thinking about far off events, you should look at the opportunities you would pursue today if not for tech debt.
The opportunity cost of projects you don’t do is often far greater than the tech debt impact on those you do. A predictive tech debt management program should take inventory of areas currently held back by technology and look at the value that better technology would unlock.
One approach is to ask product managers to list the problematic areas where they avoid making changes, and also look at top projects that didn’t make the roadmap primarily because of high engineering estimates.
The next question is: what would it look like if we did this work?
There are different approaches here, but one is to copy the current roadmap and create a hypothetical version where you fix an area of tech debt and pursue the initiatives it blocks instead of doing less valuable work.
You can then compare the total value of the hypothetical roadmap to the original one (using whatever value estimates are already in place) to calculate the incremental value created. Finally, you can combine this with estimated cost savings to bolster the case for fixing tech debt.
Modeling the future
After you’ve assessed the impact of tech debt on your immediate roadmap, the next step is to consider what is likely to happen to your organization over the next few years. This is particularly important for organizations experiencing a lot of change.
The exact way you do this will depend on your organization, but you should take time to think through plausible future scenarios with input from business stakeholders. Here’s a list of things to consider as a starting point:
Pace of Hiring - How many engineers may join the team in the future? New employees will be more impacted by tech debt than tenured engineers.
Downsizing/Offshoring - Is it likely you’ll lose some of the engineers you have today and need to get by with fewer? High tech debt can make this a lot more painful.
Customer Volume - If you had more of the same customers, how would this stress the system, especially in non-linear ways with components that have resource caps?
New Customer Requirements - What are prospective and current customers asking for today that you may need to build in the future to capture market share?
New Markets - Is the business likely to pursue new markets with different requirements like languages, currencies, pricing models, on-premise deployment, etc.?
New Distribution Channels - Will the business pursue distribution channels like resellers, affiliates, or partners that come with new requirements?
Platform APIs and Services - Is the business likely to start selling internal capabilities as services? (Tech debt can have a major impact on the ability to pull this off.)
New Technology - Which up-and-coming technologies are likely to require support or compatibility in the future?
Once you have this list of possibilities, I recommend adding two columns: likelihood and technical readiness.
Because the future holds a lot of uncertainty, you don’t have to be super precise. Three categories of (1) unlikely / (2) maybe / (3) probably and (1) high / (2) medium / (3) low will probably suffice as a starting point.
What you’re looking for here is totals of 5 or 6. These represent conversations that need to happen between engineering and business leadership. The business either needs to scale back its ambitions or invest in fixing tech debt now so that its goals are achievable in the future.
The great thing about this exercise is that it transforms the conversation from engineering costs to engineering as a primary creator of value.
Now, moving your API to GraphQL isn’t just about making engineers more productive, it’s also about gaining new services revenue and selling the product on more platforms.
Anti-fragile tech debt management
Nobody could have anticipated the pandemic, which was a black swan event. Yet, many businesses thrived – not because they predicted it, but because they were flexible and ready for anything.
The same thing is happening now with generative AI. Companies witnessing explosive growth weren’t more prescient, they were more prepared.
Nassim Taleb describes this as being anti-fragile. That is: putting yourself in a position to benefit from chaos and uncertainty.
When chaos erupts, moving quickly is essential for capitalizing on opportunities. Technical debt is like an anchor that weighs you down and ties you to the status quo. Shrewdly managing it is essential for reducing reaction time in sudden, extreme circumstances.
The fundamental difference between anti-fragile tech debt management and predictive management is that you have no list of probable events. Instead, you must look at how engineering organizations generally respond under extreme conditions (a concept Taleb calls convexity) and position yourself to benefit when they occur.
Let’s see what that looks like and how you can prepare for an uncertain future.
How Collage.com won during COVID with low tech debt
At the start of COVID, demand for photo blankets, puzzles, and other gifts skyrocketed. Supply chains were long, so every company that offered photo products was out of stock.
At the same time, no one could raise prices directly due to outstanding gift vouchers from sites like Groupon.
Collage.com (my former company), was able to quickly introduce a new “priority” shipping method between standard and expedited that was still standard shipping, but with a separate priority production queue. We then adjusted the price dynamically based on demand so “standard” might take a few months, but “priority” would always arrive quickly – in effect creating surge pricing.
We implemented this change from concept to launch in a week. Meanwhile, our biggest competitors only released major updates a few times per year.
As a result, we were the only place where you could buy photo products and receive them on time during much of the pandemic, and we were able to charge higher prices.
This ultimately led to an acquisition at around 3x the company’s pre-COVID value.
We could do this because we had invested in things prior to the pandemic like CI/CD, trunk-based development, and systems for pricing and delivery estimation.
If COVID were predictable, the framework from the earlier section would show high technical readiness for an overnight 5x demand surge, while our competitors were low.
Maintenance overhead/OpEx
The first metric to look at for assessing your ability to weather extreme events is total maintenance overhead, sometimes called “keeping the lights on (KTLO).” This is the amount of resources you need to keep your software running if you were to stop all new feature development.
In finance terminology, these are operating expenses (OpEx), while resources that go into new development are capital expenses (CapEx).
You can calculate maintenance overhead by tagging maintenance tasks in your ticketing system. It can be tricky to get this right because certain bugs are caused by new feature launches. Some people handle this by tagging those bugs differently or associating them with a capitalizable project. However you do it, the goal is to identify tasks related to fixing or configuring the current software, as well as necessary patches and updates.
Once you’ve classified maintenance tasks, you can assess how many full-time engineers you would need to run your software in maintenance mode.
Finally, you can link tech debt fixes to maintenance overhead they would eliminate, like improvements to system stability or making certain engineering tasks self-service.
The value of reducing OpEx
Every engineer that you shift from maintenance (OpEx) to new development (CapEx) directly contributes to EBITDA (earnings before interest, taxes, depreciation, and amortization).
Depending on the stage and ownership profile of your business, its total value may be primarily driven by an EBITDA multiple rather than growth rate, revenue, or profit. In this case, the direct value of reducing OpEx is the cost savings multiplied by the EBITDA multiple, which can be quite high (e.g., over 20x for SaaS businesses).
In any case, fixing tech debt that reduces OpEx can be quite valuable even under normal circumstances.
When you consider extreme events, however, the value is even greater.
If there is a sudden liquidity crunch caused by severe financial duress, being able to slim down to a low burn rate can mean the difference between survival and insolvency.
On the flip side, having low OpEx when there is a major new opportunity like generative AI frees up more people to quickly shift toward new initiatives.
For an effective anti-fragile strategy, engineering and business leadership should agree on a value multiple to use for OpEx reduction afforded by tech debt fixes. This multiple should err on the high side to account for the benefit of optionality provided by low OpEx under extreme scenarios. Tech debt fixes that cost less (in terms of engineering time) than multiplying this number by their projected OpEx savings are positive ROI and worth pursuing.
Lead time for changes
So far the metrics we’ve looked at relate to amounts of effort, not latency. A key property of black swan events (natural disasters, financial crises, political upheaval, major new technologies, etc.) is that they are often sudden.
When major unpredictable changes occur, being the first mover is a massive advantage.
The most important metric for gauging responsiveness is lead time for changes, which looks at the total elapsed time between starting work and delivering value.
As defined in traditional DORA metrics, lead time is the time between first code commit and production deployment.
However, at the business level, the lead time that really matters is the time between deciding to pursue a new initiative and delivering value to customers.
While the code lead time matters and you should measure it, you should also measure lead time at the ticket/feature level, and at the project/epic level for value delivery.
In the COVID photo product example, the crucial lead time was the time between deciding to add a new shipping method and having it live in the product. This included time for planning, design, implementation, and testing.
Tech debt can inflate lead times at all stages of the software development lifecycle (SDLC). To manage it effectively, you should estimate the impact that fixing tech debt would have on the end-to-end lead time from project conception to completion.
How much is lower lead time worth?
During normal circumstances, lower lead times drive value by allowing organizations to be more responsive to customers, thus winning sales from competitors and more rapidly iterating on customer feedback.
In the COVID photo product example, the value was similar in nature, but greatly amplified. Every week the new shipping method was live before competitors had it drove several hundred thousand dollars in revenue.
Lead time is a revenue multiplier, just like the length of the sales cycle for B2B companies. Every day you maintain a first mover advantage, you sell more. Every day a competitor has it, you lose market share.
It’s impossible to know the exact value of lead time for unpredictable future events, but it’s important to put some number on it for the purposes of deciding to fix tech debt.
Similar to OpEx reduction, engineering and business leaders should establish a lead time value multiple that is a portion of revenue. For example, if the multiple is 2, then fixing tech debt that reduces lead time by one week would be worth two weeks of revenue.
If your lead times are slower than the competition, you may want to pick an even higher number to reflect the compounding disadvantage of repeatedly losing market share over time.
End-to-end strategic tech debt management
In this article, we’ve looked at different methods for estimating the value of fixing tech debt. Beyond traditional cost analysis, we’ve shown how to account for the impact of technical prowess on revenue under both predictable and unpredictable circumstances.
By combining reactive, predictive, and anti-fragile methods together, you can assess the full value of fixing tech debt and help technology lead the organization into the future rather than follow.